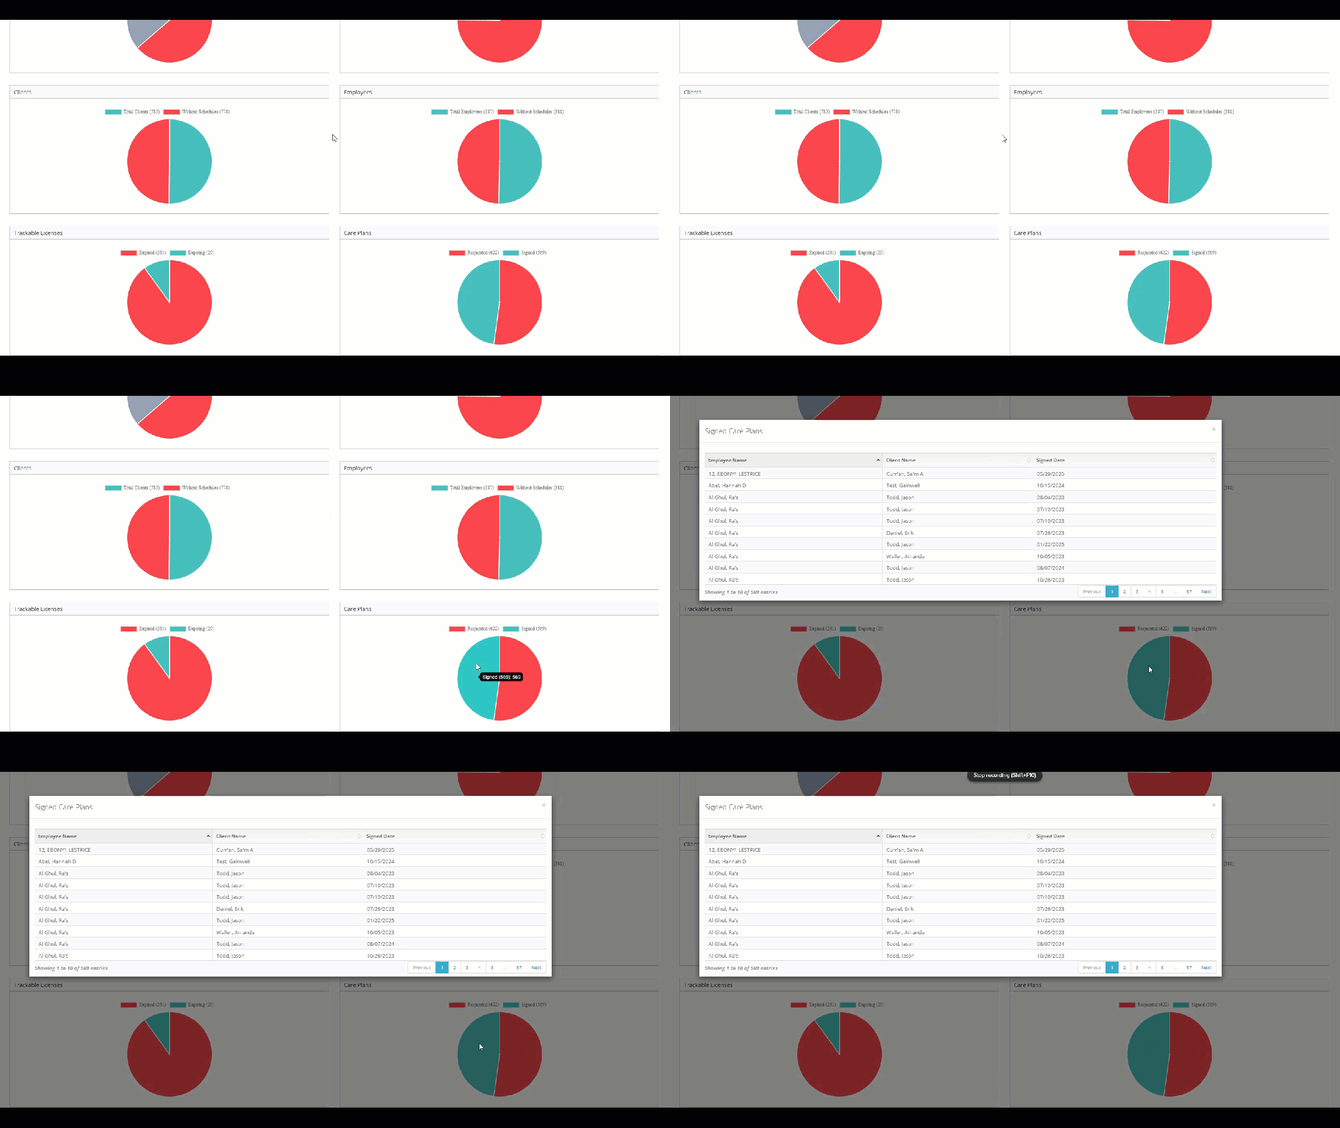
Operational Dashboard
Use the operational dashboard to quickly review schedule and service authorization information.
Table of Contents
Quick Notes
Accessing the Operational Dashboard
The Schedules Section
The Service Auth Section
The Clients Section
The Employees Section
The Trackable License Section
The Care Plan Section
Quick Notes
- The operational dashboard offers a quick view of information.
- If you're looking for more details about daily schedules, check out our daily schedule review page.
- If you're looking for more details about service authorizations, check out our service auth report page.
Accessing the Operational Dashboard
To access the operational dashboard, in the left menu navigate to:
Dashboards > Operational Dashboard
 |
The Schedules Section
In the top left of the operational dashboard, you'll find a section titled schedules. Within this section you can quickly review information for today's schedules.
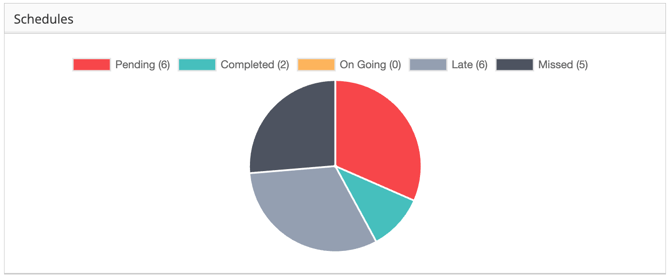 |
Each colored pie slice within the pie chart represents specific information.
| Red | Pending | The schedule has not been clocked into yet. |
| Green | Completed | The schedule has been clocked in and out of. |
| Yellow | On Going | An employee is currently clocked into this schedule, the visit is in progress. |
| Gray | Late | The schedule was clocked in for, but was marked as clocked in late for based on your agency's settings. |
| Black | Missed | The was not clocked in for, or was clocked in for after your agency's missed schedule settings. |
And, each pie slice can be clicked on to see more information about the schedules in each status.
The Service Auth Section
In the top right of the operational dashboard, you'll find a section titled service auth. Within this section you can quickly review service authorization information.
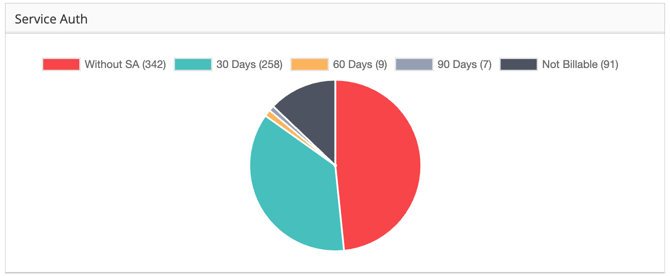 |
Each colored pie slice within the pie chart represents specific information.
| Red | Without a service authorization |
| Green | Service authorization expiring in 30 days |
| Yellow | Service authorization expiring in 60 days |
| Gray | Service authorization expiring in 90 days |
| Black | Service authorizations that was marked as not billable |
And, each pie slice can be clicked on to see more information about the service authorizations in each status.
The Clients Section
In the middle left of the operational dashboard, you'll find a section titled clients. Within this section you can quickly see what clients have or do not have visits scheduled for today.
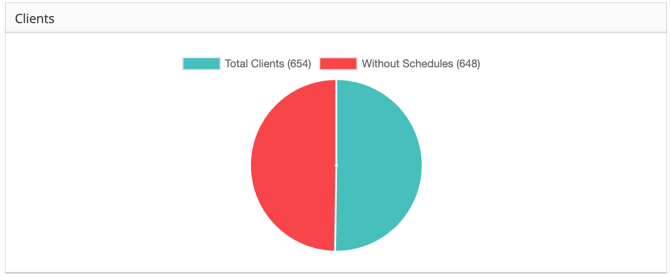 |
Each colored pie slice within the pie chart represents specific information.
| Green | Clients with visits scheduled for today. |
| Red | Clients that do not have visits scheduled for today. |
And, each pie slice can be clicked on to see more information about the clients in each status.
The Employees Section
In the middle right of the operational dashboard, you'll find a section titled employees. Within this section you can quickly see what employees have or do not have visits scheduled for today.
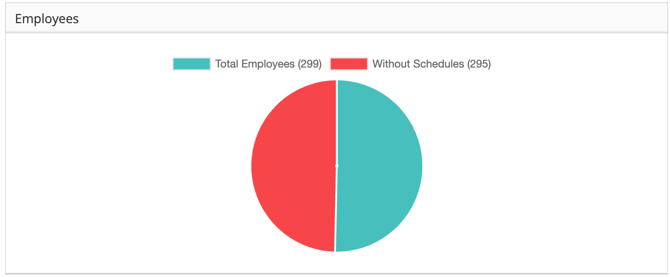 |
Each colored pie slice within the pie chart represents specific information.
| Green | Employees with visits scheduled for today. |
| Red | Employees that do not have visits scheduled for today. |
And, each pie slice can be clicked on to see more information about the employees in each status.
The Trackable License Section
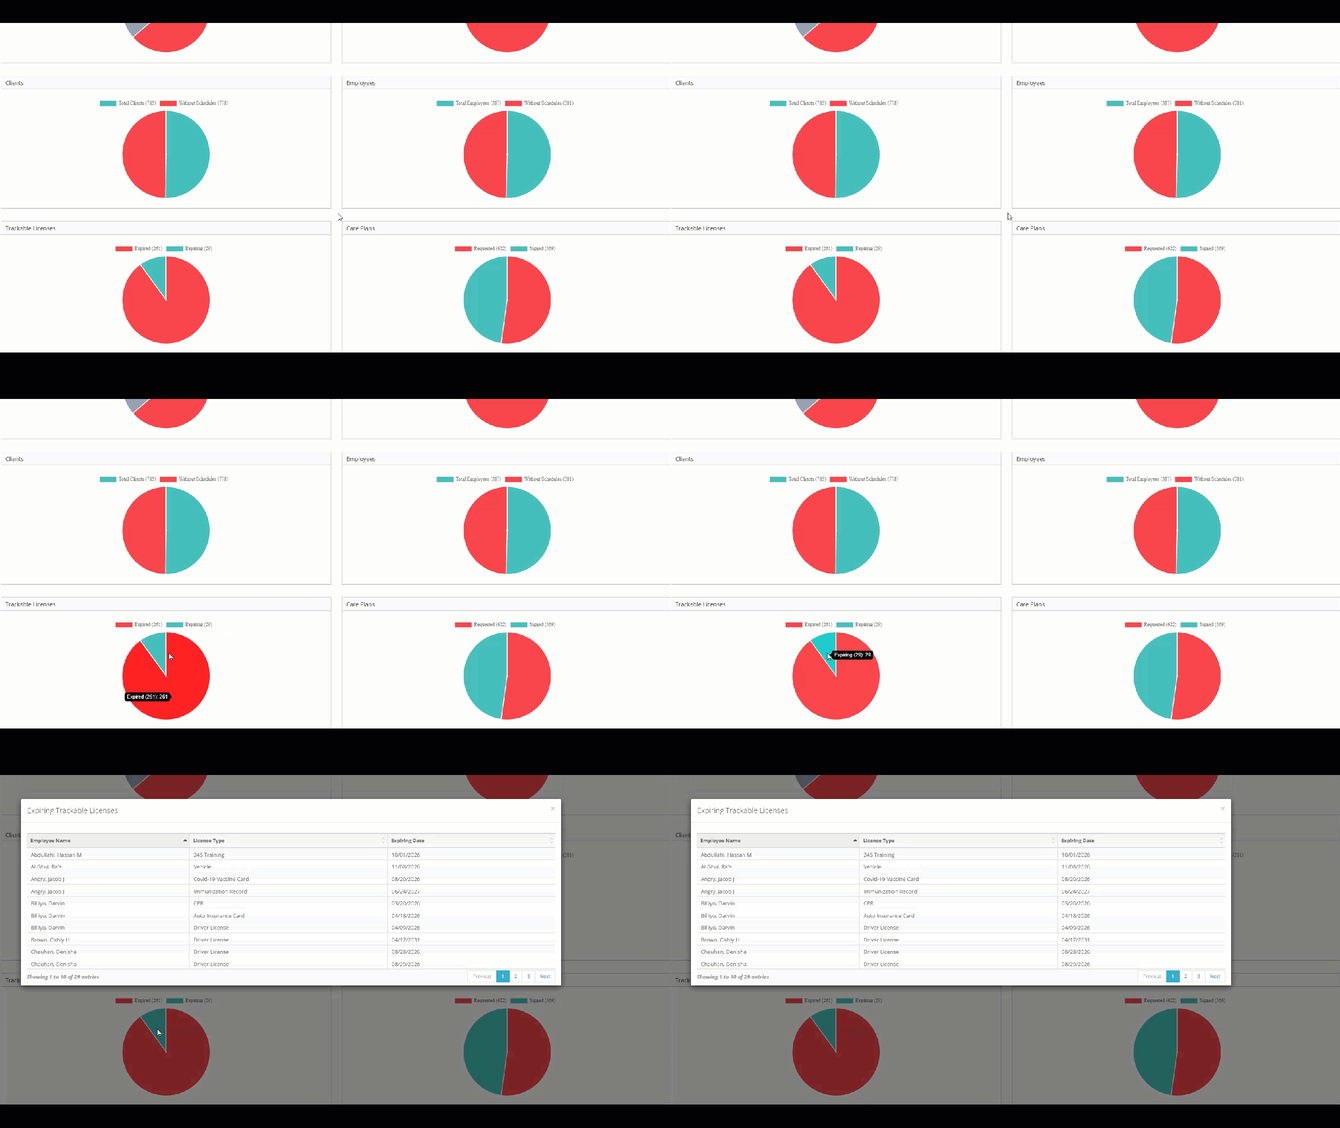
In the bottom right of the operational dashboard, you'll find a section titled Trackable Licenses. Within this section you can quickly see what which employee licenses have expired and which ones are still current.
 |
Each colored pie slice within the pie chart represents specific information.
| Green | Trackable licenses that are still active |
| Red | Trackable licenses that have expired. |
And, each pie slice can be clicked on to see more information about the license and its expiration date.
The Care Plan Section
In the bottom right of the operational dashboard, you'll find a section titled Care Plan. Within this section you can quickly see which care plans are singed and which care plans still need a signature.
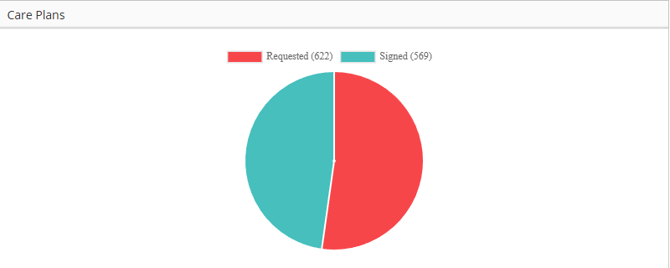 |
Each colored pie slice within the pie chart represents specific information.
| Green | Signed care plans |
| Red | Unsigned care plans |
And, each pie slice can be clicked on to see more information about the care plan and its expiration date.
